VE6KQ REPEATER COVERAGE
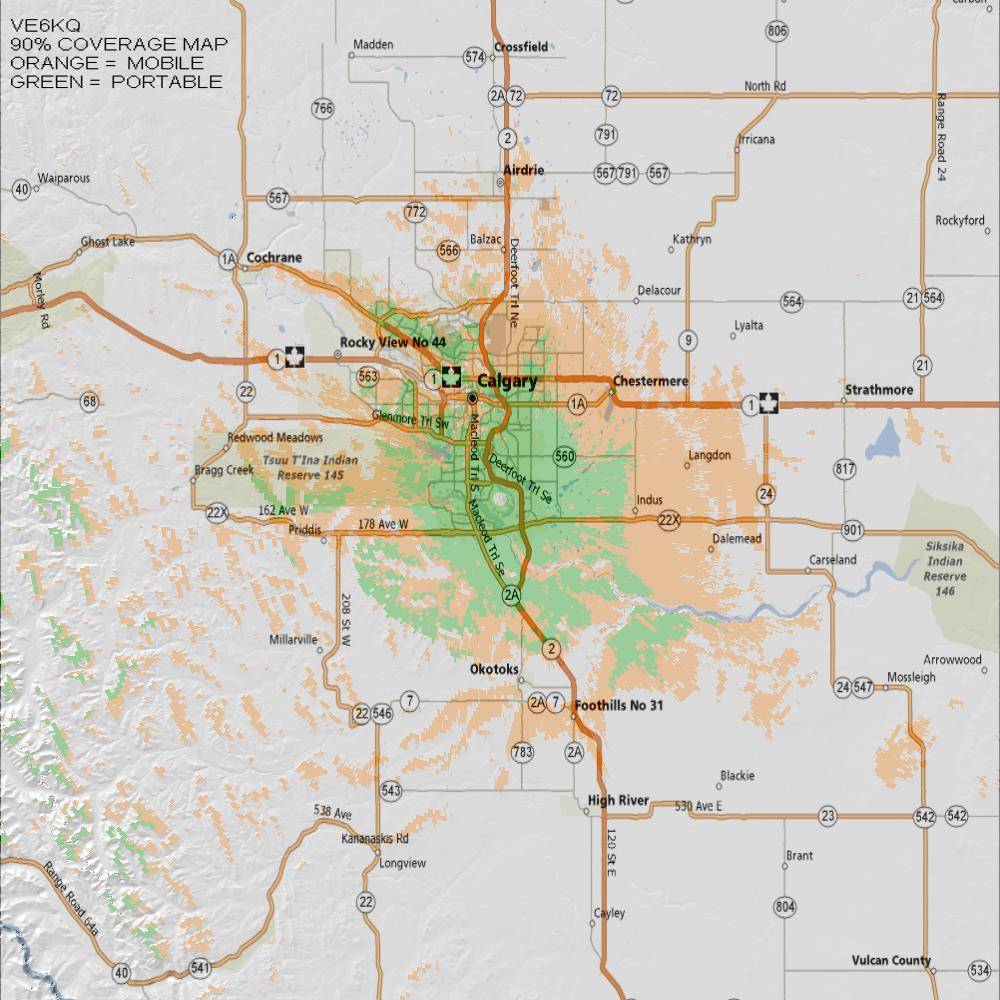
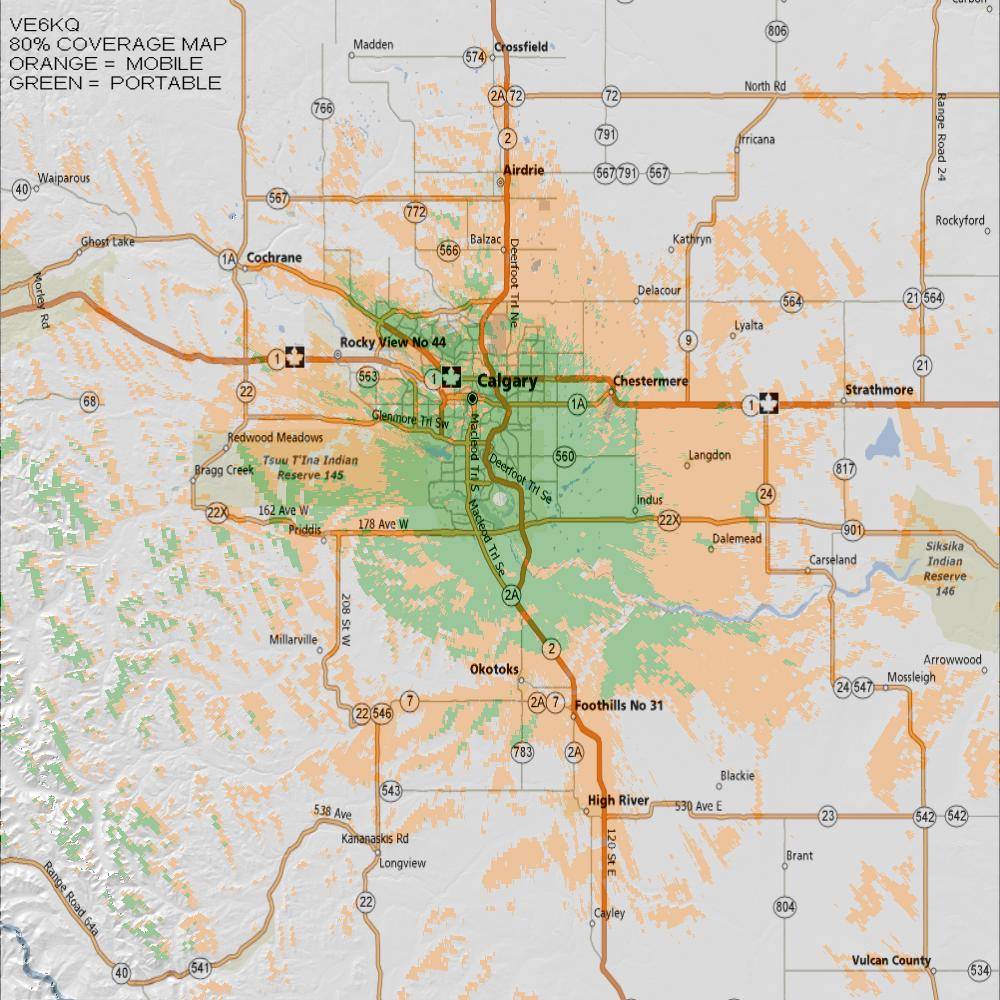
The first two maps below were produced using the Radio Mobile software. Orange indicates mobile coverage and green portable coverage. With the top map the prediction assumed 90% worst case coverage and the next map 80% worst case coverage. Worst case refers to the differences between the talkback and talkout to and from the repeater. For example, a portable may receiver the repeater better than the repeater can receive it.
Mobile data entered was for 30 Watts output and a roof mounted 3 dBd antenna. The portable, 2 Watts output and a -10 dBd antenna. The coverage indicated appears to be quite accurate as compared with empirical observations taken over the years.
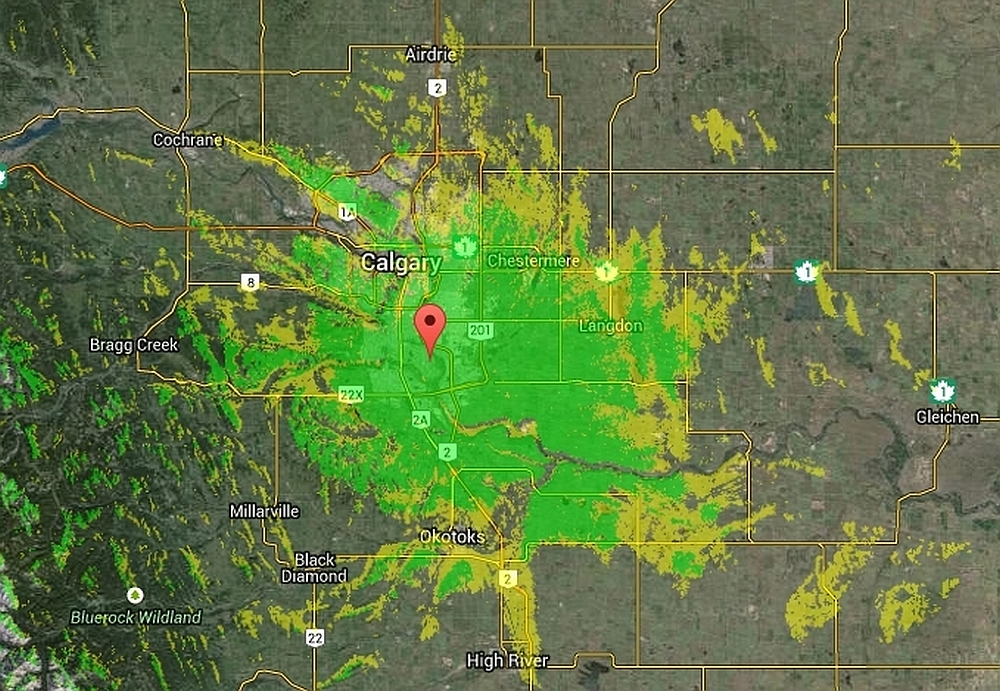
The map below was developed using the Radio Mobile on-line software. This software required fewer data inputs than the above so I assume the prediction may not be quite as accurate. The green is 90% reliability for mobile coverage and the yellow is 10 percent less. Transmit power use for the calculations was 20 Watts and mobile antenna gain was 4 dBd.